TESTING: Content blocks and css

16 min read
| Published on
Executive summary
In our report, The powerful business impact of HR measurement practices, Catalyst revealed the results of our survey of 563 HR leaders across the United States, the United Kingdom, and Canada, showing how many HR measurement practices their organizations were using and which had the most business impact.
In this breakout of data from the United States, we find that HR leaders at organizations that adopt nearly all talent best practices are more likely to report meaningful improvements in business performance, customer loyalty, the attraction and retention of underrepresented talent, and overall employee experiences of inclusion compared to HR leaders at organizations that adopt fewer best practices. As US companies navigate shifting regulations, heightened scrutiny, and evolving expectations around workplace culture, CHROs and HR leaders must make strategic choices about how they measure and manage talent. Use this data to discover how adopting evidence-based, equity-focused HR measurement practices can unlock stronger business outcomes and build workplaces where all employees can thrive.
How to cite: Gutierrez, L., Shaffer, E., & Robotham, K. (2026). The powerful business impact of HR measurement practices in the United States. Catalyst.
US findings
We asked 187 HR leaders, managers, and practitioners from US organizations in a range of industries what types of HR measurement best practices they employ. Our data showed that 66% of companies stood above the rest in both:
- Number of practices.1
- The data they are able to report on because they track experiences by gender, race, and ethnicity.
We call these companies “superior” because, on average, they implement 91% of the 57 best practices we asked about. We call the other 34% of companies “standard” because, on average, they implemented 52% of the best practices.2
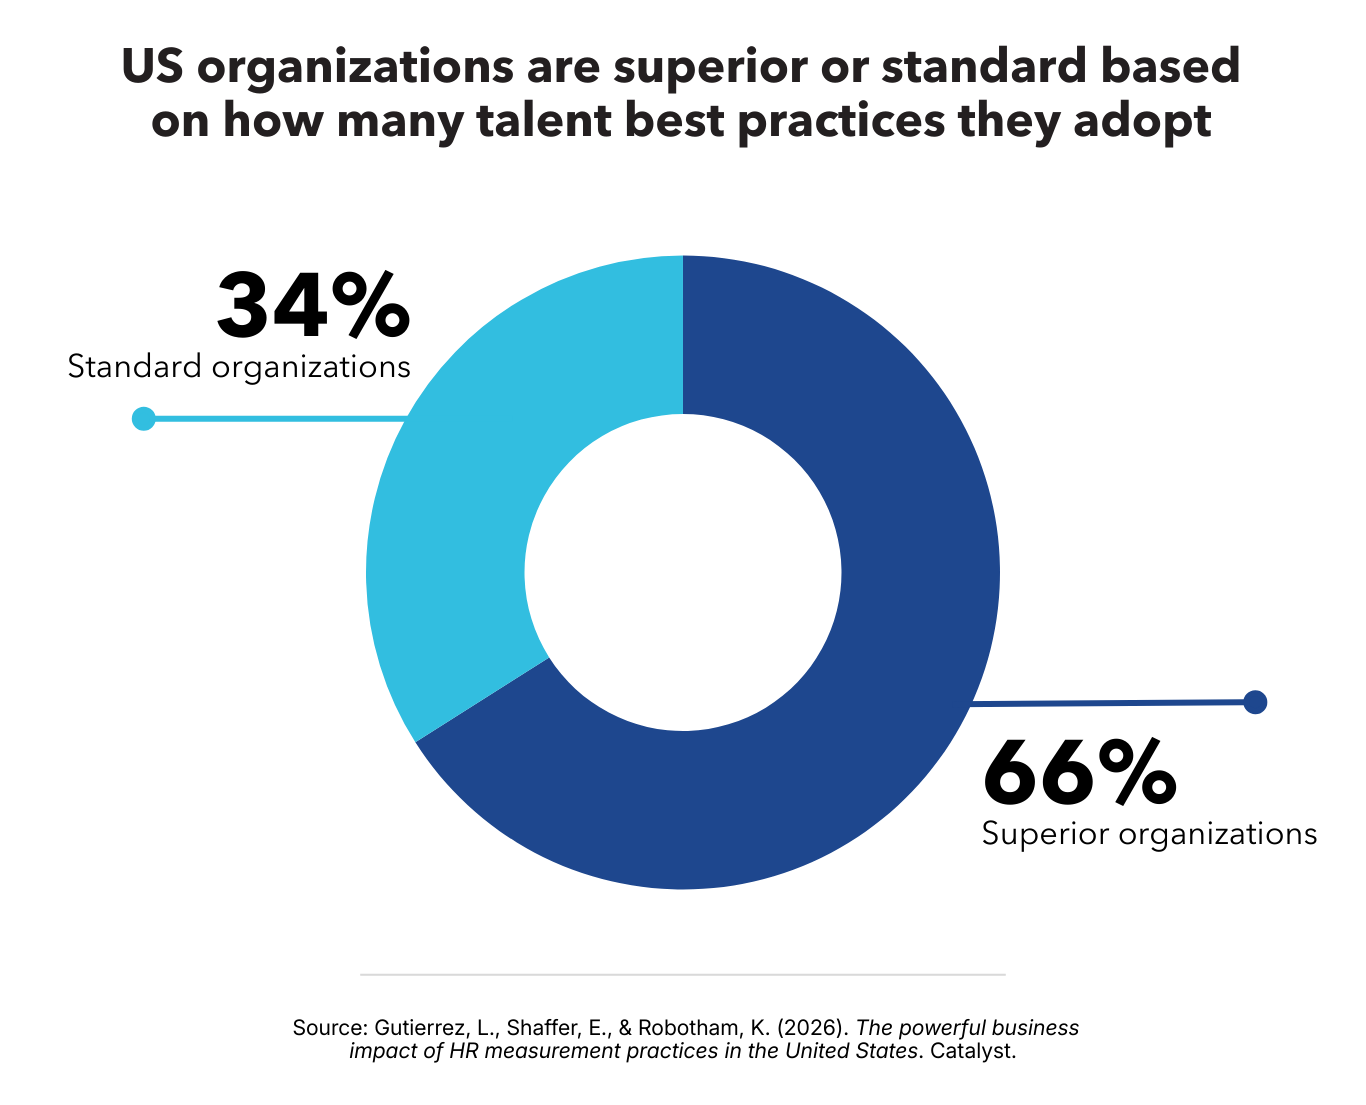
What is the benefit of being a superior company? There are many business benefits of implementing more HR best practices. Engaging in more practices is linked to higher reported business performance,3 customer loyalty,4 ability to attract5 and retain6 employees from underrepresented backgrounds, employee engagement,7 and employee experiences of inclusion.8
Top ten practices
In addition to the number of practices a company adopts, the type of practices makes a difference too. Superior organizations are more likely than standard organizations to implement measurement practices that detect gender, racial, and ethnic inequities in the workplace.
The top ten practices that set superior organizations apart from standard organizations all involve ensuring that employees are gaining similar experiences and opportunities regardless of gender, race, or ethnicity. On average, superior organizations engage in every one of these practices while only 40-49% of standard organizations do.9
Body component: The top ten practices that set superior organizations apart from standard organizations all involve ensuring that employees are gaining similar experiences and opportunities regardless of gender, race, or ethnicity.
&emdash; Jeanne Testing
Superior organizations:
- Analyze performance ratings by gender to identify and address disparities.10
- Track employee participation in development programs by gender to ensure equitable access.11
- Track promotion outcomes by gender and hold leaders accountable for equitable advancement.12
- Conduct annual pay audits that include analysis of pay disparities across race and ethnicity.13
- Track promotion outcomes by race/ethnicity and hold leaders accountable for equitable advancement.14
- Track applicant rates by race/ethnicity to assess and improve fairness in the hiring process.15
- Track employee participation in high-visibility assignments by race/ethnicity to ensure equitable access.16
- Track interview rates by race/ethnicity to assess and improve fairness in the hiring process.17
- Track employee participation in high-visibility assignments by gender to ensure equitable access.18
- Analyze employee inclusion data by race/ethnicity to identify and address gaps in experience.19
Superior organizations perform best
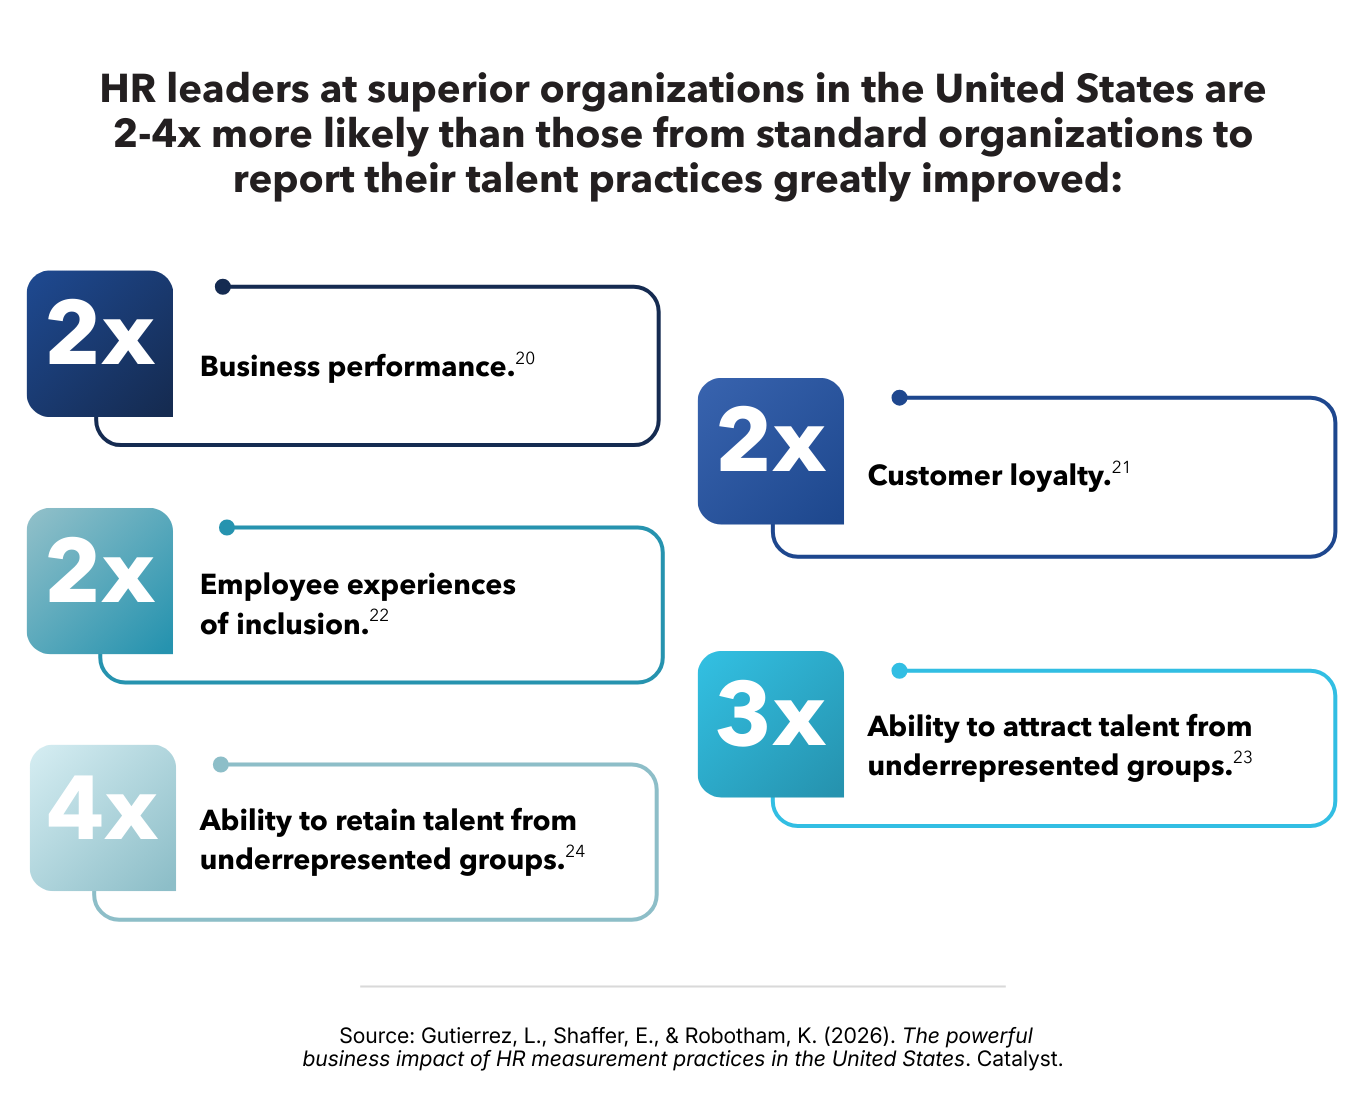
CHROs should take note: Superior organizations consistently outperform standard ones on key organizational outcomes.
Passez à l’action
Si vous êtes un dirigeant RH ou d’entreprise, il est essentiel de prendre des décisions éclairées sur les pratiques de gestion des talents. Nos données montrent que la mise en œuvre d’un ensemble complet de pratiques incluant le suivi des résultats de performance selon le genre, la race et l’ethnicité peut donner à votre organisation l’avantage dont elle a besoin. En utilisant les données pour garantir que votre système reste exempt de biais, vous pouvez vous assurer que les meilleurs talents se démarquent. Que votre organisation mette déjà en œuvre ces pratiques, qu’elle rafraîchisse ses stratégies de collecte de données ou qu’elle ait suspendu certaines pratiques, utilisez les ressources suivantes pour tracer une voie à suivre.
Demographics
Total number of respondents: 187
| Age | Gender | Race or ethnicity | Top 10 Industries | Organization size |
|---|---|---|---|---|
42 | 53% | 62% | 21% | 19% |
21 – 73 | 47% | 18% | 17% | 27% |
13% | 16% | 46% | ||
3% | 9% | 8% | ||
3% | 8% | |||
< 1% | 7% | |||
6% | ||||
6% | ||||
3% | ||||
3% |
Endnotes
- A two-step cluster analysis was conducted to explore patterns of engagement in the total number of talent-related best practices among organizations in the US. Each input for this analysis was comprised of the total number of practices in six areas: performance management, development, compensation, retention culture, recruitment, and onboarding. The solution revealed two clusters: organizations that adopted more talent best practices (“superior” companies; n = 123, 66%) and organizations that engaged in fewer talent best practices (“standard” companies; n = 64, 34%).
- An independent samples t-test was conducted to examine the difference in adoption of best practices between superior organizations versus standard organizations in the US. We used the sum of best practices adopted by organizations as the outcome. The average number of best practices adopted by standard organizations (M = 29.38) was significantly lower than the average for superior organizations (M = 51.83), t(99.56) = -22.90, p < .001.
- A linear regression was conducted to examine the impact of the number of best practices adopted by US organizations on reported business performance. The model was significant, R2 = .07, F(1, 180) = 12.84, p < .001. The more best practices an organization implemented, the greater the reported improvement to business performance (b = .02, SE = .005, p <.001).
- A linear regression was conducted to examine the impact of the number of best practices adopted by US organizations on customer loyalty. The model was significant, R2 = .07, F(1, 178) = 13.85, p < .001. The more best practices an organization implemented, the greater the reported improvement to customer loyalty (b = .02, SE = .005, p < .001).
- A linear regression was conducted to examine the impact of the number of best practices adopted by US organizations on their ability to attract applicants from underrepresented backgrounds. The model was significant, R2 = .12, F(1, 181) = 24.04, p < .001. The more best practices an organization implemented, the greater the reported ability to attract applicants from underrepresented backgrounds (b = .02, SE = .005, p < .001).
- A linear regression was conducted to examine the impact of the number of best practices adopted by US organizations on their ability to retain employees from underrepresented backgrounds. The model was significant, R2 = .19, F(1, 181) = 43.50, p < .001. The more best practices an organization implemented, the greater the reported ability to retain employees from underrepresented backgrounds (b = .03, SE = .005, p < .001).
- A linear regression was conducted to examine the impact of the number of best practices adopted by US organizations on employee engagement. The model was significant, R2 = .08, F(1, 183) = 15.28, p < .001. The more best practices an organization implemented, the greater the reported improvement on employee engagement (b = .02, SE = .004, p < .001).
- A linear regression was conducted to examine the impact of the number of best practices adopted by US organizations on employee experiences of inclusion. The model was significant, R2 = .10, F(1, 183) = 20.19, p < .001. The more best practices an organization implemented, the greater the reported improvement on employee experiences of inclusion (b = .02, SE = .004, p < .001).
- A two-step cluster analysis was conducted with the 57 items used to gauge talent-related practices that US organizations have adopted. The solution revealed two clusters: organizations that adopted more talent best practices (“superior” companies; n = 67, 54%) and organizations that engaged in fewer talent best practices (“standard” companies; n = 57, 46%).
- This best practice in performance management was adopted by all the superior organizations in our sample (100%), whereas 40% of standard organizations adopted this practice. Furthermore, a logistic regression was conducted to examine how “superior” versus “standard” organizations differ in the extent to which they analyze performance ratings by gender. The logistic regression was statistically significant: X2 (1) = 77.51, p < .001, Nagelkerke R Square = .49. In the US, HR leaders from superior companies are 25 times more likely to report that their organization engages in this talent practice compared to HR leaders from standard companies, b = 3.21, Exp(B) = 24.83, p < .001.
- This development-related best practice was adopted by all the superior organizations in our sample (100%), whereas 42% of standard organizations adopted this practice. Furthermore, a logistic regression was conducted to examine how “superior” versus “standard” organizations differ in the extent to which they track employee participation in development programs by gender. The logistic regression was statistically significant: X2 (1) = 99.89, p < .001, Nagelkerke R Square = .60. In the US, HR leaders from superior companies are 48 times more likely to report that their organization engages in this talent practice compared to HR leaders from standard companies, b = 3.87, Exp(B) = 48.00, p < .001.
- This best practice related to performance management was adopted by 97% of superior organizations in our sample, whereas 42% of standard organizations adopted this practice. Furthermore, a logistic regression was conducted to examine how “superior” versus “standard” organizations differ in the extent to which they track promotion outcomes by gender and hold leaders accountable for equitable advancement. The logistic regression was statistically significant: X2 (1) = 95.75, p < .001, Nagelkerke R Square = .56. In the US, HR leaders from superior companies are 38 times more likely to report that their organization engages in this talent practice compared to HR leaders from standard companies, b = 3.64, Exp(B) = 38.16, p < .001.
- This compensation-related best practice was adopted by mostly all of the superior organizations in our sample (98.5%), whereas 46% of standard organizations adopted this practice. Furthermore, a logistic regression was conducted to examine how “superior” versus “standard” organizations differ in the extent to which they conduct annual pay audits that include analysis of pay disparities across race/ethnicity. The logistic regression was statistically significant: X2 (1) = 48.36, p < .001, Nagelkerke R Square = .35. In the US, HR leaders from superior companies are 13 times more likely to report that their organization engages in this talent practice compared to HR leaders from standard companies, b = 2.57, Exp(B) = 13.12, p < .001.
- This best practice related to performance management was adopted by almost all the superior organizations in our sample (98.5%), whereas 46% of standard organizations adopted this practice. Furthermore, a logistic regression was conducted to examine how “superior” versus “standard” organizations differ in the extent to which they track promotion outcomes by race/ethnicity and hold leaders accountable for equitable advancement. The logistic regression was statistically significant: X2 (1) = 90.61 p < .001, Nagelkerke R Square = .55. In the US, HR leaders from superior companies are 36 times more likely to report that their organization engages in this talent practice compared to HR leaders from standard companies, b = 3.59, Exp(B) = 36.15, p < .001.
- This recruitment-related best practice was adopted by almost all the superior organizations in our sample (98.5%), whereas 46% of standard organizations adopted this practice. Furthermore, a logistic regression was conducted to examine how “superior” versus “standard” organizations differ in the extent to which they track applicant rates by race/ethnicity to assess and improve fairness in the hiring process. The logistic regression was statistically significant: X2 (1) = 44.94, p < .001, Nagelkerke R Square = .32. In the US, HR leaders from superior companies are 12 times more likely to report that their organization engages in this talent practice compared to HR leaders from standard companies, b = 2.44, Exp(B) = 11.52, p < .001.
- This development-related best practice was adopted by all the superior organizations in our sample (100%), whereas close to half (49%) of standard organizations adopted this practice. Furthermore, a logistic regression was conducted to examine how “superior” versus “standard” organizations differ in the extent to which they track employee participation in high-visibility assignments by race/ethnicity. The logistic regression was statistically significant: X2 (1) = 79.17, p < .001, Nagelkerke R Square = .51. In the US, HR leaders from superior companies are 29 times more likely to report that their organization engages in this talent practice compared to HR leaders from standard companies, b = 3.36, Exp(B) = 28.67, p < .001.
- This recruitment-related best practice was adopted by almost all the superior organizations in our sample (98.5%), whereas almost half (49%) of standard organizations adopted this practice. Furthermore, a logistic regression was conducted to examine how “superior” versus “standard” organizations differ in the extent to which they track interview rates by race/ethnicity to assess and improve fairness in the hiring process. The logistic regression was statistically significant: X2 (1) = 34.55, p < .001, Nagelkerke R Square = .26. In the US, HR leaders from superior companies are 9 times more likely to report that their organization engages in this talent practice compared to HR leaders from standard companies, b = 2.16, Exp(B) = 8.66, p < .001.
- This development-related best practice was adopted by all the superior organizations in our sample (100%), whereas 47% of standard organizations adopted this practice. Furthermore, a logistic regression was conducted to examine how “superior” versus “standard” organizations differ in the extent to which they track employee participation in high-visibility assignments by gender. The logistic regression was statistically significant: X2 (1) = 95.11, p < .001, Nagelkerke R Square = .60. In the US, HR leaders from superior companies are 60 times more likely to report that their organization engages in this talent practice compared to HR leaders from standard companies, b = 4.10, Exp(B) = 60.47, p < .001.
- This retention culture best practice was adopted by nearly all the superior organizations in our sample (97%), whereas 47% of standard organizations adopted this practice. Furthermore, a logistic regression was conducted to examine how “superior” versus “standard” organizations differ in the extent to which they analyze inclusion data by race/ethnicity to identify and address gaps in experience. The logistic regression was statistically significant: X2 (1) = 62.95, p < .001, Nagelkerke R Square = .42. In the US, HR leaders from superior companies are 18 times more likely to report that their organization engages in this talent practice compared to HR leaders from standard companies, b = 2.91, Exp(B) = 18.33, p < .001.
- One item measured the extent to which business performance improved based on US organizations’ adoption of talent-related best practices. The outcome variable was dichotomized: respondents who answered “1-not at all” to “3-to some extent” were grouped with one another, and respondents who answered “4-to a great extent” were grouped together. A logistic regression was conducted to examine how superior versus standard organizations differed in their reported improvements in business performance. The logistic regression was statistically significant: X2 (1) = 4.64, p = .03, Nagelkerke R Square = .03. In the US, HR leaders from superior companies are two times more likely to report that engagement in talent-related best practices improved their business performance compared to HR leaders from standard companies, b = 0.68, Exp(B) = 1.98, p = .03.
- One item measured the extent to which customer loyalty improved based on US organizations’ adoption of talent-related best practices. The outcome variable was dichotomized: respondents who answered “1-not at all” to “3-to some extent” were grouped with one another, and respondents who answered “4-to a great extent” were grouped together. A logistic regression was conducted to examine how superior versus standard organizations differed in their reported improvements in customer loyalty. The logistic regression was statistically significant: X2 (1) = 6.45, p = .01, Nagelkerke R Square = .05. In the US, HR leaders from superior companies are two times more likely to report that engagement in talent-related best practices improved their customer loyalty compared to HR leaders from standard companies, b = 0.81, Exp(B) = 2.25, p = .01.
- One item measured the extent to which employee experiences of inclusion improved based on US organizations’ adoption of talent-related best practices. The outcome variable was dichotomized: respondents who answered “1-not at all” to “3-to some extent” were grouped with one another, and respondents who answered “4-to a great extent” were grouped together. A logistic regression was conducted to examine how superior versus standard organizations differed in their reported improvements in employee experiences of inclusion. The logistic regression was statistically significant: X2 (1) = 4.77, p = .03, Nagelkerke R Square = .03. In the US, HR leaders from superior companies are two times more likely to report that engagement in talent-related best practices improved employee experiences of inclusion compared to HR leaders from standard companies, b = 0.69, Exp(B) = 2.00, p = .03.
- One item measured the extent to which attracting talent from underrepresented groups improved based on US organizations’ adoption of talent-related best practices. The outcome variable was dichotomized: respondents who answered “1-not at all” to “3-to some extent” were grouped with one another, and respondents who answered “4-to a great extent” were grouped together. A logistic regression was conducted to examine how superior versus standard organizations differed in their reported improvements in attracting applicants from underrepresented groups. The logistic regression was statistically significant: X2 (1) = 9.29, p = .002, Nagelkerke R Square = .07. In the US, HR leaders from superior companies are three times more likely to report that engagement in talent-related best practices improved their ability to attract talent from underrepresented groups compared to HR leaders from standard companies, b = 0.97, Exp(B) = 2.64, p = .003.
- One item measured the extent to which retaining talent from underrepresented groups improved based on US organizations’ adoption of talent-related best practices. The outcome variable was dichotomized: respondents who answered “1-not at all” to “3-to some extent” were grouped with one another, and respondents who answered “4-to a great extent” were grouped together. A logistic regression was conducted to examine how superior versus standard organizations differed in their reported improvements in retaining employees from underrepresented groups. The logistic regression was statistically significant: X2 (1) = 16.36, p < .001, Nagelkerke R Square = .11. In the US, HR leaders from superior companies are four times more likely to report that engagement in talent-related best practices improved their ability to retain employees from underrepresented groups compared to HR leaders from standard companies, b = 1.33, Exp(B) = 3.79, p < .001.